
The Women Behind the Chart: How Her Retrofit Space Is Rewriting the Rules on Insulation Data

For years, conversations about insulation in retrofit have been dominated by numbers. Lambda values. U-values. A world of digits that feel precise but tell only part of the story.
Now, a small team led by Ellora Coupe and Aniko Hegedus at Her Retrofit Space CIC has decided to change that. Their new Insulation Comparison Chart is not another spreadsheet of conductivity values: it is an open, evolving map of how real materials behave in real buildings.
It began, as many revolutions do, with frustration.

The Spark
Aniko, an architectural technologist based in Denmark, had spent years specifying materials across Europe. Her projects ranged from straw bale housing to hempcrete retrofits. Yet every time she needed to compare products, she found the same narrow logic: charts that celebrated thermal conductivity as the single measure of worth.
“I was triggered by how limited those charts were,” she explained. “They only talked about one thing, lambda values, when that is just a fraction of a material’s real behaviour. You can’t judge insulation on that alone. Moisture movement, heat capacity, diffusivity, all of that matters to how a wall or roof performs.”
That frustration turned into action. In one of Her Retrofit Space’s informal online meet-ups, a member shared another of these charts, and Aniko couldn’t hold back. “Don’t get me going,” she said. Then she and Ellora decided to make their own.
It was the kind of decision that sits perfectly within the spirit of Her Retrofit Space: practical, collaborative, and quietly radical.
Building the Chart
The work began in earnest with a simple principle: make the invisible visible.
If thermal conductivity was the headline number everyone knew, they wanted to show the full cast list beneath it. The new chart gathers both thermal and hydric data, revealing how insulation materials deal with moisture, how quickly they transfer heat, and how well they store it.
Aniko’s expertise in bio-based materials meant the list quickly expanded beyond the usual suspects. Denim insulation, wood fibre, straw, cork, hemp, and clay-based blocks sit beside mineral and synthetic alternatives.
“I wanted to show a balanced view,” she said. “Yes, I love biogenic materials, but this chart is not an activist tool. It is a professional one. There are times you need XPS or mineral wool because the building dictates it. What matters is that specifiers have the full data and the confidence to decide.”
Behind each value lies a source. If a figure is not published by the manufacturer, it is taken from independent studies such as Thermal Insulation Materials for Building Applications (Latif et al., Cardiff University, 2019). A small star next to a number signals this transparency: a sign that the data did not come from corporate marketing, but from research.
This attention to provenance is rare in a sector where even major reports rely on opaque manufacturer data sheets buried in PDFs.
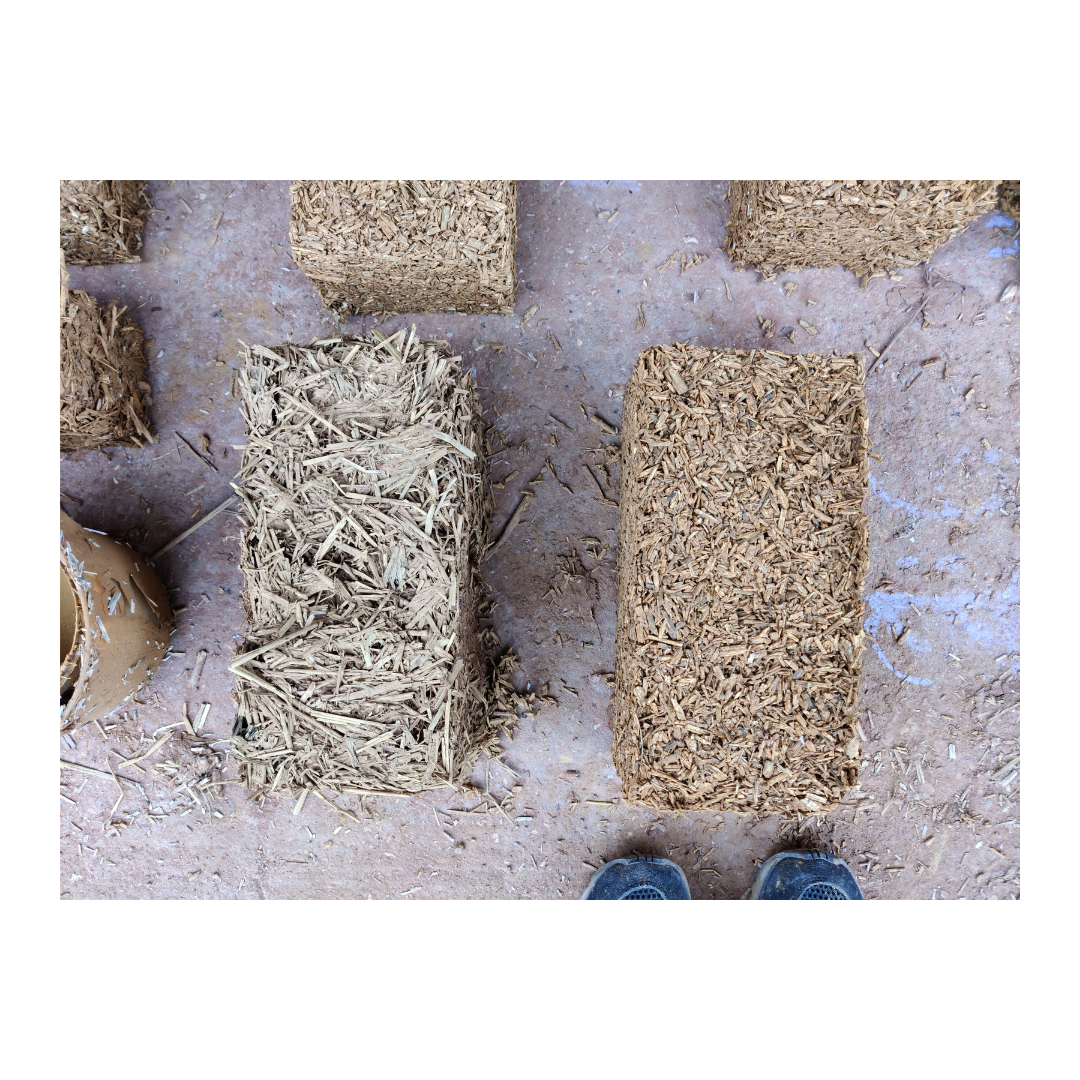
Aniko Works With Many Materials
A Question of Trust
The conversation between data and trust runs through the retrofit industry like a fault line.
For decades, much of the public information on materials has been shaped by the companies that make them. Trade bodies publish “guidance” which, on closer inspection, reads like advertising. Whole standards have been written with preferred products in mind.
At Refurb & Retrofit, we have covered examples where the game was openly rigged. Manufacturers have swapped out competitor materials in test rigs, rewritten performance comparisons, and submitted results that serve their shareholders more than their customers.
When Ellora and Aniko began to assemble their chart, they knew that independence would be its greatest value.
“This data doesn’t exist anywhere in a consolidated, transparent form,” said Ellora. “We decided to give users not only the numbers, but the evidence behind them. Every entry links to the public data sheets used to compile it. That is the core of this tool, it is not about telling people what to use, but showing exactly where the information comes from.”
It is a refreshing approach in a world where information is often guarded or monetised. Her Retrofit Space, structured as a Community Interest Company, was designed precisely to resist those pressures. It operates without corporate funding or hidden sponsorship, and that independence has become part of its credibility.
“We don’t want to rely on grants or corporate partners who might steer our focus,” Ellora explained. “Our model is about creating tools that the industry genuinely needs, charging fairly for access, and using that income to keep improving them.”
See A Teaser Of The Resource
Who It’s For
The first edition of the Insulation Comparison Chart is aimed squarely at professionals. Architects, retrofit designers, coordinators, researchers, and advanced students can all use it to compare materials quickly and accurately.
But the real aim is bigger. The tool is designed to spark new conversations between manufacturers, specifiers, and researchers about the gaps in knowledge that still slow down retrofit.
“Manufacturers should use it to see where their own data is missing,” Ellora said. “We want this to encourage better testing, better transparency, and shared standards.”
The chart is dynamic, not static. Every three months it will be updated with new materials, data corrections, and user feedback. Subscribers will receive notifications when changes go live.
It also includes a discussion forum, inviting users to post questions, case studies, and field results. Over time, that conversation will create an archive of real-world evidence to complement the numerical data.
For now, the chart is being released in wait list form, allowing professionals to register early access before it officially opens later this week.
The Bias Question
Aniko acknowledges a gentle bias toward natural materials, but not in the way her critics might expect.
Her bias is toward evidence, not ideology. She believes that biogenic materials often perform better because they are more complete systems: they breathe, buffer, and store heat in ways synthetics cannot. Yet she is quick to point out that no single material is right for every building.
“I would never say ‘don’t use XPS’ or ‘don’t use rockwool,’” she said. “If you are retrofitting a building with a shallow foundation, for example, you might need a thinner high-performance board to maintain structural integrity. The point is not to make moral judgments. It’s to give professionals the tools to make informed choices.”
The chart reflects that balance. It is not colour-coded, and it avoids the “traffic light” simplicity that turns complex design into red, amber, and green. It assumes that users will have enough understanding to interpret context and nuance.
For those just beginning their retrofit journeys, that nuance can be daunting. The team knows that, which is why they already have a second version in mind, one that will translate this technical data into accessible insights for homeowners.
From Members to Movement
Her Retrofit Space began as a platform for women in retrofit to connect, share, and collaborate. It has since evolved into one of the most progressive communities in the sector.
The insulation chart emerged directly from its members. During online discussions, architects and designers kept returning to the same issue: the hours wasted hunting for reliable data, and the difficulty of justifying specifications to clients when every chart told a different story.
By creating a shared resource, the team has solved a practical problem and given members something tangible to use in their daily work.
“Our members were the ones who pushed for it,” Ellora said. “They told us how useful it would be to have all this data in one place. That was the turning point. We realised this could save people huge amounts of time.”
The chart is already in use across member projects, and early feedback has been enthusiastic. Many report using it to cross-check manufacturer claims or explore less familiar materials like straw panels or diatomaceous lime plasters.
Each discovery leads to another conversation, exactly the kind of collaborative learning Her Retrofit Space was built to foster.
The Bigger Picture
The implications of this project stretch far beyond one chart. It points to a cultural shift within retrofit: a move away from hero products and toward systems thinking.
When insulation is judged solely by how quickly it slows heat, we risk designing buildings that fail in every other respect. Moisture movement, indoor air quality, thermal mass, and embodied carbon all shape how comfortable and durable a retrofit will be.
As heat waves become more frequent in northern Europe, these secondary properties are becoming urgent. Aniko has seen it firsthand in Denmark.
“Even here, people underestimate overheating,” she said. “When big architectural firms dismiss straw or wood fibre because it needs a thicker wall, they ignore the fact that those materials can store heat and keep indoor temperatures stable. Specific heat capacity matters as much as conductivity now. We need to talk about that.”
Her point is simple: the future of insulation is not thinner, it’s smarter.
The Independent Middle Ground
One of the hardest problems in retrofit communication is trust. Manufacturers are seen as biased, academics as abstract, and government guidance as outdated.
Her Retrofit Space occupies a rare middle ground: independent, knowledgeable, and connected to practice. It is the kind of initiative that gives specifiers confidence and policymakers something solid to reference.
In a sector obsessed with certification, the chart is refreshingly uncertified, not because it rejects standards, but because it aims to inform them.
Ellora explains: “Our goal isn’t to compete with certification. It’s to complement it. We want to highlight where the data is missing so that standards bodies can respond. If a manufacturer sees a star next to their numbers and decides to test properly, that’s a win.”
That openness has already drawn attention from across the industry. Researchers, students, and small manufacturers have begun contacting the team to ask how they can contribute or verify their data.
Why This Matters Now
Retrofit is entering a new phase. The easy wins, loft rolls, draught-proofing, cavity fills - are largely done. The next wave involves complex fabric upgrades in homes that vary wildly in construction and condition.
Specifiers need confidence. Homeowners need clarity. And the market needs integrity.
Tools like this chart help all three. By consolidating data, removing bias, and keeping the conversation open, they create the foundation for smarter decisions.
When we first heard about the project, Refurb & Retrofit asked the obvious question: why not make it free?
Ellora’s answer was both honest and strategic. “We want this to be sustainable,” she said. “We’re a non-profit, but we still need to pay for hosting, research, and updates. Selling access means we can keep it alive without depending on short-term funding or corporate sponsorship. And because it’s live, subscribers get the benefit of regular updates instead of a static PDF.”
It is a model that fits the times: independent, transparent, and community-owned.
For now, the chart is on wait list, with early sign-ups receiving first access when it officially opens later this week.
A Tool for the Whole Sector
Beyond architects and designers, the chart will be valuable to product developers, buyers, and retrofit coordinators.
Students can use it to compare material properties across categories. Manufacturers can see how their data stacks up against competitors. Researchers can spot gaps that merit further study.
Crucially, it also provides a base for case study collaboration. Each user can upload examples of how materials performed in practice. Over time, this will form an evidence base far more useful than isolated lab tests.
As Aniko puts it, “We want people to talk about how these materials behave in real buildings. That is what changes minds.”
A Shared Reference Point
When asked what makes their chart different from searching online, Ellora’s answer was blunt: “Because you can actually find things.”
Most manufacturer data is buried inside PDFs that don’t appear in search results. Finding one number can take hours.
This chart turns that chaos into order. One click reveals a clear table of average values, backed by direct links to each manufacturer’s sheet.
“It’s about saving time,” Ellora said. “Every architect I know spends days pulling this stuff together. Now they don’t have to. And because it’s all in one place, the data can be discussed, questioned, and improved. That’s what progress looks like.”
Where to Find It
The Insulation Comparison Chart from Her Retrofit Space CIC is now available to join via wait list before it officially opens later this week. Early registrants will receive exclusive access to the live dataset, source library, and discussion forum once it goes live.
Quarterly updates are planned, and early subscribers will help shape version two.
For architects and retrofit professionals looking to make confident, evidence-based material choices, this chart could become an essential reference.
Precision and Trust
Retrofit thrives on detail. Every house, every wall, every junction is different. The more we understand about materials, the better we can design systems that work in the real world.
By reclaiming the data and putting it in one open, evolving platform, Her Retrofit Space has done something quietly transformative. It has reminded the industry that knowledge is power—but only when shared.
As Ellora said near the end of our conversation:
“We didn’t set out to make noise. We just wanted to make sense. And sometimes that’s the most radical thing you can do.”
Join the wait list: In Her Retrofit Space – Insulation Comparison Chart
(Her Retrofit Space CIC – transparent data for retrofit professionals, opening this week)